

I found this video on YouTube... its fun. Have a great weekend & remember.... Hug a Developer!
You can now view or download and deploy one of the first real enterprise JavaFX application. We took the popular Seam booking demo application and created JavaFX UI for it. The JavaFX side is connected to Seam via Flamingo RIA framework. View online You can view and run the application by going to this URL: http://demo.flamingo.exadel.com/booking/. You will also see JSF/RichFaces and Flex versions of the application. All instances are connected to the same Seam back-end. Once you register, you can use the same name/password information to login using any other user interface.
What could you do with your code in 20 Lines or Less? That's the question I ask (almost) every week for the devcentral community, and every week I go looking to find cool new examples that show just how flexible and powerful iRules can be without getting in over your head. Here are a few more cool iRules from the forums. This week I’ve included one of the simplest, shortest iRules to ever make the 20LoL. It just struck me as something quite useful that I’m willing to bet several people will look at and say “oh, that’s handy” despite the fact that it’s not complex or long. Keep the code coming.
The personal navigation market is growing rapidly and the downloadable applications for the top-rated Apple iPhone are creating a wide array of choices for the consumer. The XRoad G-Map, the first on-board navigation application that can locate the current position and navigate to a destination without Wi-Fi and internet connection, got a jump start when they launched the very first turn-by-turn GPS navigation system for the iPhone late in 2008 to excellent reviews.
Two Degrees Mobile (http://www.2degreesmobile.co.nz/) is New Zealand’s newest mobile company. They’ve spent $250 million constructing a brand new mobile network in New Zealand and have launched their offering this week with extremely aggressive pricing. This upstart telecoms operation is set to shake up the market in New Zealand and hopefully (for the consumers) bring mobile charges down to levels that will encourage a massive growth in mobile communication.
There are a number of esteemed contests for the greatest and fastest software developers among us – events where we can pit our coding prowess against fellow brainiacs and like-minded techies. I think it’s high time we had an alternative set of awards, suited not to aspiring budding Turing machine engineers, but rooted more in the humdrum real, rather than artificial academic, world.
Apple first thing Monday morning said Google CEO Eric Schmidt is leaving the Apple board, a position that has raised eyebrows with the regulators as Google enters sectors such as phones and operating systems in competition with Apple. The Apple announcement, put in the mouth of CEO Steve Jobs, acknowledged the situation.
Sybase Chairman & CEO John Chen talks to CNN Fortune, about the risks associated and rewards associated with changing the tech company's core focus. John also talks about where he sees the current economy. John is a great believer of the fact that a "technology company needs to provide technology". That is now in effect as Sybase continues to provide innovation in the mobile space, after a lot of investment in time as well as money.
Elastic Grid, LLC is pleased to announce the Elastic Rack project. As part of Elastic Grid project commitment to provide a cloud virtualization layer, the Elastic Grid team was in need of a Java API which would drive the Rackspace Cloud Servers API. This Java API is now available as a separate bundle in the Elastic Rack project. This open-source project aims to provide Java APIs to the Rackspace Cloud APIs so that Java developers can easily call Rackspace APIs. As of today, there is only experimental support for Cloud Servers API.
Exadel Flamingo RIA framework comes with CRUD application generator. Using the maven-based generator, you can easily generate JavaFX user interfaces connected to Spring or Seam back-ends. In this post I showed how to do it Seam. Let’s do the same with Spring framework. There are just a few simple steps. If you don’t [...]
Fujitsu Technology Solutions is going to OEM Citrix’ XenDesktop, integrate it with “high-definition” HDX technology, and add it to its virtual workplace solutions to give enterprise customers a rich, personalized virtual desktop experience from any location. The combined solution is supposed to speed deployment of thousands of desktops at a time.
Google has launched Google Latitude For Iphone – a service that lets you tell your friends where you are. Big brother has landed You control who gets to see your location and where on the map you appear to others. Today, we’re releasing Google Latitude for iPhone and iPod touch, available in the Safari browser. You can add a bookmark to your iphone home screen to quickly launch Google Latitude. Visit google.com/latitude from your iphone to start using Latitude. Just open Latitude in Safari and tap the + icon > Add to Home Screen > Add. There’s more info on the Google Mobile Blog. I’ll be signing up for that tomorrow to see exactly what’s in store – cool! Iphone at the ready...
In part one of this article we started building a small Rich Internet Application that would display music charts using data from a YQL query. We started with Adobe Illustrator to mock up the user interface for our app, then transferred the Illustrator file into Flash Catalyst to begin converting the design into an interactive piece.
In part two, we will continue adding interactivity in Catalyst, and then move into Flash Builder to finish it up. For fun, there’s a quiz at the end!
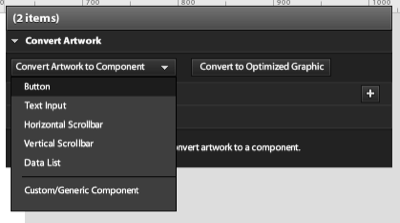
Each of the tabs on the left of our application will now be converted into a button component. We’ll do this by selecting both the text and background graphic for the first tab, and using the Heads Up Display (HUD) to convert it into a button. Repeat this process for the other two tab graphics.
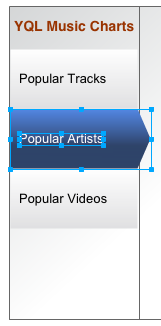
Button components have four states:
Buttons for each of these states appear within the HUD whenever one of your buttons has been selected. We can edit each of the states’ graphics individually by clicking on them.

Double-click on the button with the blue arrow graphic to select it, and copy the button. Use the breadcrumb at the top of the Design area to switch out of the button, and then double-click one of the other two buttons. Go to the Over state, delete the graphic that’s there, then paste the blue arrow in its place. To align it precisely, look at the Properties panel and set the X and Y values to 0. You should now find that the arrow is positioned perfectly.
Something missing? The text in that state will most likely have disappeared, because the blue arrow will have been placed into a new layer above the text. To make it reappear, simply go to the Layers panel and grab and drag the text layer and drop it above the new graphic layer. This text will also need a change of font color.
Currently, Catalyst’s ability to edit graphics is quite limited. We’re able to modify this label’s size and opacity, but to change other attributes like color or font, we need to return to Illustrator. To do that, right click on the text object and choose Edit in Adobe Illustrator CS4.. You can do this either in the design area, or within the Layers palette.

This will launch the artwork in Illustrator – only the text will be editable‚ and the remaining content will be disabled. You’ll also see a bold yellow message above the Illustrator artboard, telling you to save and close the window when you’re finished.
In Illustrator, change the font colour to white and save. Illustrator will prompt you to save with FXG options‚ FXG is the new language that Catalyst uses to exchange graphics between itself and Adobe design tools like Illustrator and Photoshop. Accept the defaults and close the file in Illustrator, and then switch back to Catalyst. There’ll be a dialog asking you whether you want to accept the Illustrator changes. Accept them, and you’ll see the text with its new colour.
Repeat that process for the button’s Down state. You’ll need to copy a grey background from one of the other two buttons to use for the Up and Disabled states in the Popular Artists button as it had the blue arrow graphic when we created it. You’ll also need to change the colour of the font for this button in Illustrator to black for the Up and Disabled states‚ so let’s do that now.
Back in part one, we created a Data List component for the list of tracks. The repeated item in the Data List features some interactivity that may not be apparent until testing‚ you can do this by choosing File > Run Project. In your browser, you’ll see the application appear in a new tab or window. You should notice that when you roll over or click on an item, the items reveal a subtle light blue background: we’re going to adjust the background colour to be a bit brighter.
Double-click on the repeated item component to open it, and you’ll see the three states that represent different interactions‚ normal, hovered, and selected. Managing the appearance of the way the item changes across states is relatively easy; we simply edit the appearance of the object in each state, much as we did for buttons.
First, we’ll modify the colour of the background in the Hovered state. Right click on the background image and choose Edit in Adobe Illustrator CS4.. Change the fill colour of the graphic to a shade to your liking. Save the changes in Illustrator and switch back to Catalyst, accepting the change it asks for. You’ll see that the background colour of the Hovered state has been updated. We can do the same for the Selected state.
The music chart up/down arrow needs states too; we’ll show an up or down arrow to show how the track has changed chart position lately. Since none of the pre-set component types in Catalyst will be able to help us with this task, we’ll need to convert the arrow into a custom component. Select the arrow and select Custom/Generic Component from the Convert Artwork list. Then, choose Duplicate State from the top left of the screen‚ it’s a small button just below the Pages/State list. At the top right of Catalyst is a toolbar: clicking the last one, Transform, will let you rotate the arrow to point down. Double-clicking on the name of a state will allow you to rename it. Here, I’ve named the states trackUp and trackDown, respectively.

The list will look a little empty until the user has selected a music chart to display. We’re going to set the application to start with the list hidden, only displaying it once the data has been fetched from Yahoo. We’re going to use two application states to achieve this effect.
Duplicate the current state and rename it to defaultState, then name the second one chartState. Select the Data List in defaultState and delete it: you’ll see that the list is still in the second state when you switch between the two.
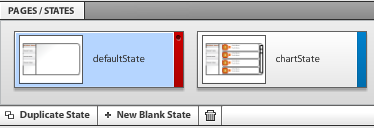
When a user presses one of the chart buttons on the left, we’d like to show the chartState. To make this happen, we’ll choose one of the buttons in the first state and select the plus button to the right of Custom Interactions in the HUD. Choose On Click from the list. From On Click Interactions choose Play transition to state and choose chartState from the list. For the user, clicking on the button will make the list appear. Later, we’ll add code to that button in Flash Builder to call a Yahoo YQL query to fetch the data to display in the list.


Repeat the process for each of the buttons. With the interactions added you should see that each object has a Fade transition effect added to the Timeline below the design view. The switch between states’ actions can be animated with that Fade effect. Sliding the effect in the Timeline to control it is quite intuitive: simply grab it and move it. You’re now ready to test the interactions. Choose File > Run Project to run the application again, and click on the buttons to see the change between states. Adjust the interaction changes in the Timeline to taste.
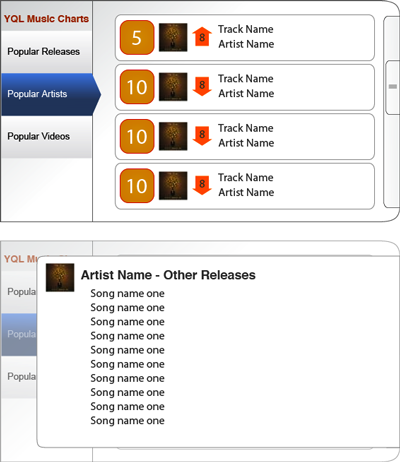
We’re going to add one more state to the application to serve as a detail view for the repeated items: this will use the artwork from the detailed view we created all the way back in part one. The additional panel will behave like a pop up to display other releases for a selected artist.
Start by duplicating chartState – call the new state artistDetailState. The design has a pop over panel to display the new information. We’re going to dim the current content for this state as the detail panel appears. Do this by selecting all the items in the state except the background graphic, and set their opacity to 40 in the properties panel.
If you look carefully at the Layers palette you’ll see a layer called Overlay. This contains all the objects that will be shown in the detail state. When we do this, we’ll make the repeated item a button. Go back to chartState and enter the Data List component by double-clicking on it, then open the repeated item by double-clicking again, and select its background. Convert the background into a button using the HUD and set its On Click event to play to artistDetailState. The Fade effect in the Timeline will do a really nice job of transitioning the opacity later on if you choose to use it. The detail view has repeated data in its design. Later, we’ll convert this to a component in Flash Builder. For now, delete the text, leaving the title text as is.
Oops‚ I’ve just realised we forgot to provide a way of closing the panel in the artwork! This is a great excuse to show you how to create a new button from scratch in Catalyst.
To do it, draw a circle with the Ellipse tool found in the toolbar at the top right of Catalyst‚ it looks like a circle itself. Add a letter X with the Text tool to the center of the circle and select the two, converting them to a button from the HUD‚ feel free to edit the button to have other graphics in the other states if required. Add an On Click interaction to the new button and set it to switch back to chartState to close the panel.
With all of the interactions the way we want them, we’re almost ready to complete the project in Flash Builder! This is a great time to double-check that you’ve saved your work.
While we’ve been working on our project, Catalyst has been building a number of MXML files that Flash Builder can compile to Flash. It’s possible to view that code right here in Catalyst by switching from Design to Code view‚ do this by using the pull-down menu at the top right in Catalyst. Save the Catalyst project and then launch Flash Builder.
In Flash Builder, you can create a project from an FXP file by selecting File > Import Flex Project (FXP). Using the navigator on the left, locate the project’s root file at src > (default package) > Main.mxml. You’ll see that there is a fx:Script block at the top of the code that contains functions for each of the three buttons that you created in Flash Catalyst. Also, note the s:transitions tag pair, which contains any transition effects you may have added via the Timeline in Catalyst. Below that the states are defined in the s:states tag pair. Finally, you should see buttons and other visual elements, all of which have been assigned instance names that we can access from ActionScript.
We’re going to be calling a Yahoo service called YQL to fill our application with data. It’s a language that you can use to query data from web services. You will need to have a developer account with Yahoo to build and test with YQL: more details can be found at the Yahoo developers’ site. YQL queries are simply URLs with your query attached as a string at the end. You can choose to have the results returned as either XML or JSON using an additional variable at the end of the URL to indicate the return type‚ &format=xml or &format=json, respectively.
The Flex HTTPService component is used to call a remote HTTP service. We need to add one HTTPService for each YQL call, and both these tags need to be nested in a pair of fx:Declarations tags.
Below is an example of a HTTPService call to a YQL service to retrieve the most popular music tracks. The URL value of the tag is the YQL query. The tag’s result attribute indicates what function to use once the query result is received. Flash Builder will prompt to create the outline of a function for you if you add that attribute, which is what we’ve chosen to do here. The resultFormat attribute is used to indicate how the result’s data will be typed. To provide feedback to the user, we’ve also used the showBusyCursor attribute to change the cursor while the data is being fetched.
<s:HTTPService id="trackPopularService"

  url="http://query.yahooapis.com/v1/public/yql?

  q=select%20*%20from%20music.track.popular"

  result="releasePopularService_resultHandler(event)"

  resultFormat="xml" showBusyCursor="true"/>
These services will be called by clicking on one of the buttons that we created in Flash Catalyst. There’s a click handler function for each button already in the fx:Script block at the top of the code. These click handlers were created in order of button creation by Catalyst – you may need to run the application later to double check that the names match the positions. Here’s an example of one of these button click handlers: we’ve added a second line to it to call the URL of the HTTPService discussed above.
protected function Button_click():void

  {

    currentState='chartState';

    trackPopularService.send();

  }
The function that will be called once the result has been received has a ResultEvent parameter, which in turn has a result property. This is where we’ll find the XML data that we need to populate the Data List. Flex data components have a dataProvider property that typically has an ArrayCollection assigned as its value. This is a wrapper class that exposes an array as a collection, but essentially is an array of objects that has additional methods and properties. We’ve already defined a variable typed as ArrayCollection called chartData in the script block and made that bindable so that any component using that variable as a dataProvider will update if the ArrayCollection changes. Here’s that variable:
[Bindable] private var chartData:ArrayCollection = new ArrayCollection();The function for the result of the first HTTPService call is listed below. You’ll notice that we reset the chartData ArrayCollection by re-initializing it. We then create an XML variable out of the event’s result property, then loop over the XML to parse it. With each iteration of the loop we create an object called dataObj and add properties to it which are equal to specific values in the XML. The last thing that we do in the loop is use the ArrayCollection‘s addItem method to add dataObj to it.
protected function releasePopularService_resultHandler(event:ResultEvent):void

  {

    chartData = new ArrayCollection();

    var resultsXML:XML = XML(event.result);

    var tracksXMLList:XMLList = resultsXML.child("results").children();

    var len:Number = tracksXMLList.length();

    for ( var i:Number = 0;i<len;i++) {

      var dataObj:Object = new Object();

      dataObj.track = tracksXMLList[i].attribute("title");

      dataObj.artist = tracksXMLList[i].child("Artist").attribute("name");

      dataObj.artistID = tracksXMLList[i].child("Artist").attribute("id");

      dataObj.chartNow = tracksXMLList[i].child("ItemInfo").child("ChartPosition").attribute("this");

      dataObj.chartPrevious = tracksXMLList[i].child("ItemInfo").child("ChartPosition").attribute("last");

      chartData.addItem(dataObj);

    }

}The Data List we created in Catalyst is used as the skin for a Flex List component. That’s located in the code below the three buttons, which you’ll see in the following example. Catalyst has manually added values to populate the list by nesting an ArrayCollection. You’ll see that the dataProvider attribute is there, but has an empty string value. We’re going to delete that ArrayCollection and bind the dataProvider attribute to our chartData ArrayCollection. Below, you’ll notice I’ve used a pair of curly brackets, this will repopulate the list if the value of chartData changes.
<s:List x="200" y="89" skinClass="components.DataList1" id="list1" includeIn="artistDetailState,chartState" alpha.artistDetailState="0.4" dataProvider="{chartData}"/>The repeated item that we built in Catalyst is now a component in the Flex project. It’s stored in a file, RepeatedItem1.mxml, which can be found in the components folder of the project. Open it and you’ll see RichText components that we’ll need to populate with data from the List’s dataProvider. You should see that the text attribute of each of the RichText components is already bound to a property of an object called data‚ this is the collective name given to the values passed by the List component the current row as it loops over the dataProvider. We need to update the text attribute of each of these RichText tags to equal the data we’ve received.
The example code below is one of the RichText components from RepeatedItem1.mxml. Look at the text attribute of this tag and you’ll see that its value is bound using curly brackets‚ this means it will update to the current value assigned, which in this case is data.chartNow. The chartNow value is in the chartData ArrayCollection that we populated with the function detailed above. It’s one of the properties of the dataObj object that we built and populated while we looped over the XML data received from the YQL service call. Check the other RichText tags and you’ll see that we’ve also updated ours to equal other properties in the data from the ArrayCollection.
<s:RichText width="38" height="54"

  textAlign="center" fontFamily="Helvetica"

  fontSize="30" lineHeight="120%" color="0xffffff"

  whiteSpaceCollapse="preserve" kerning="on"

  ai:knockout="0" d:userLabel="5" text="{data.chartNow}"

  x="14" id="richtext1" y="18"></s:RichText>
We’ve added a function to the fx:Script block of RepeatedItem1.mxml to change the display of the chart arrow to either up, down or hidden based on music chart movement. It’s using the chartNow and chartPrevious values from the same data we used to populate the RichText tags. The function is controlling the chart arrow component, which in this case will have a name like customcomponent11. That function is called each time we render a row by using the opening tag’s render event. You’ll find that in the first line of code in RepeatedItem1.mxml in our sample version. The function is detailed below:
private function chartPosIndicator():void {

  if (data.chartPrevious == "0" ) {

    customcomponent11.visible = false;

    richtext2.text = "new";

  } else if ( Number(data.chartNow) < Number(data.chartPrevious) ) {

    customcomponent11.currentState = 'trackUp';

  } else if ( data.chartNow == data.chartPrevious ) {

    customcomponent11.visible = false;

    richtext2.text = "";

  } else if ( Number(data.chartNow) > Number(data.chartPrevious) ) {

    customcomponent11.currentState = 'trackDown';

  }

}
The other function in RepeatedItem1.mxml calls a public method in the parent file, Main.mxml, passing the artistID and artist values for the current row.
protected function Button_click():void

{

  mx.core.FlexGlobals.topLevelApplication.showArtistReleases(data.artistID,data.artist);

}
This function in turn assigns the values received to local variables already created, calls the send method of the last HTTPService, and changes the state of the application to artistDetailState.
public function showArtistReleases(selectedArtistID:Number,selectedArtistName:String):void {

  artistID = selectedArtistID;

  artistName = selectedArtistName;

  releaseArtistService.send();

  currentState='artistDetailState';

}
The fourth HTTPService call uses a parameter to retrieve releases for a specific artist. We need to use the data from the row that the user clicks on to make that work, which is why we’re using the two functions listed above. The first calls the second from within RepeatedItem1.mxml, passing the artistID needed as a parameter for the HTTPService call. Within the second function, we’re assigning that artistID to a local variable that we’re using within the url attribute of the last HTTPService call. Below is that URL, and if you look towards the end of the value you’ll see {artistID}, which is a binding to the variable.
url="http://query.yahooapis.com/v1/public/yql?q=select%20*%20from%20music.release.artist%20where%20id%3D%22{artistID}%22"The result handler function for that service call is similar to the other result functions. Instead of the chartData ArrayCollection, we’re populating another ArrayCollection called otherReleasesArtist. This is used to populate a DataGrid component that we’ve added to the details panel we build as part of this article. The panel can be found in the components directory as CustomComponent2.mxml. We’ve added an ArrayCollection to this component and used it as the dataProvider for the DataGrid, setting the ArrayCollection as public so that we can change its value from Main.mxml – this is set in the last line of the result handler listed below. We’re also setting the title of the panel to the artistName variable passed when RepeatedItem1.mxml was clicked.
protected function releaseArtistService_resultHandler(event:ResultEvent):void

{

  otherReleasesArtist = new ArrayCollection();

  var resultsXML:XML = XML(event.result);

  var tracksXMLList:XMLList = resultsXML.child("results").children();

  var len:Number = tracksXMLList.length();

  for ( var i:Number = 0;i<len;i++) {

    var dataObj:Object = new Object();

    dataObj.releaseTitle = tracksXMLList[i].attribute("title");

    dataObj.releaseYear = tracksXMLList[i].attribute("releaseYear");;

    otherReleasesArtist.addItem(dataObj);

  }

  customcomponent21.artistName = artistName;

  customcomponent21.otherReleasesData = otherReleasesArtist;

}
And that should be it! Save your work, and test your application by pressing the Run button at the top of Flash Builder. If all went well, chart data should start flowing into the completed application.
You can view my completed app here, and if you’re interested in viewing the complete source of my project, you can download my Flash Builder project here.

Through both parts of this article we have demonstrated how to design a Flash application interface using Illustrator, and then convert the resulting Illustrator file into interactive Flash content using Flash Catalyst. Designers can now easily translate their design skills into interactive user interfaces and add functionality using Flash Builder. So, congratulations – you’ve just created a Flash masterpiece!
Why not test your knowledge of this article with our quiz?
via Comments on:
“In many ways, cloud computing is simply a metaphor for the Internet, the increasing movement of computer and data resources onto the Web. But there’s a difference: cloud computing represents a new tipping point for the value of network computing. It delivers higher efficiency, massive scalability, and faster, easier software development. It’s about new programming [...]
"I liked it better in Portland," said one OSCON attendee to another during Thursday's lunch. This comment summed up the feeling of OSCON 2009 at the San Jose Convention Center. Nice people, wrong venue. Portland's progressive reputation and its status as the North American home of open-source deity Linus Torvalds made it the perfect place for this modest event. The cavernous, sterile confines of the largest convention center in sterile Silicon Valley brought the excitement surrounding OSCON down several notches.
Sybase reported historical Q2 records achieved in operating, income, operating margin, net income, EPS, and cash flow. Revenue and EPS exceeded first call consensus. Management raised full-year guidance for revenue, EPS, and cash flow.
Lightstreamer and Valemobi from Sao Paulo, Brazil have signed an agreement where Valemobi will distribute Lightstreamer's push technology as part of Valemobi's platform for Real-time iPhone solutions. "We chose Lightstreamer because this is the state-of-the art middleware for distributing real-time data. Lightstreamer has proven it's mature enough for financial mission-critical applications, and it will be part of our mobile data distribution suite for the Brazilian Stock Exchange, the ValeBroker, says Leonardo Magalhães, CTO at Valemobi.
Yahoo’s revenues for the June quarter fell 13% year-over-year to $1.57 billion earning $141 million, up 8%, 10 cents a share, or 16 cents a share non-GAAP. The company, which took a $65 million restructuring charge, owes the earnings uptick to cost cuts.
Our guest blogger this month is Brad Sellick, a recent Bug Battle winner with expertise in mobile testing (see his full bio below). In this post, Brad examines the shortfalls of simulation tools in testing mobile applications. There’s a challenge in developing and testing applications that is as old as the personal computer itself. The challenge [...]te cast)
Adobe announced two new Adobe Flash Platform open source initiatives for developers, media companies and publishers. The new efforts will help content owners extend their online media efforts, as they look to create new business opportunities and monetization strategies for publishing on the Web.
ShoZu Ltd (www.shozu.com), the award-winning social media hub, and Touchnote Ltd (www.touchnote.com), the award-winning mobile print-on-demand service, today announced a partnership that gives users of ShoZu’s iPhone mobile application a fast, convenient way to print any photo and have it mailed to anywhere in the world in 24 hours by Touchnote. This partnership represents one of the earliest adoptions of Apple’s iPhone In-App micropayments. The service demonstrates how ShoZu is adding value for customers of its paid smartphone applications, and how Touchnote can work with iPhone application developers to integrate their app with Touchnote’s fulfillment library.
Flash Catalyst, formerly codenamed Thermo, promises to make the process of converting an interface design to code a smooth and easy experience. In this tutorial, spread over two parts, Andrew Muller shows us how to build a nifty Flash application that retrieves music chart data from Yahoo!, using Illustrator, Flash Catalyst, and Flash Builder. Pay attention – there’s a quiz at the end!
Note: To play along at home, you’ll need to grab the following:
Designers have a variety of tools they use on a regular basis to do their day job, often sticking to the one that they know best. Adobe’s Illustrator and Photoshop are two that dominate the software list of choice for interface designers of all stripes, whether they’re involved with site design, rich internet application (RIA) development, or any other kind of screen-based experience. Then, the design is handed over to a developer to convert into a working interface.
A shortcoming of this design process is that, while it allows the designer to create a look for a web application, it’s impossible to see the feel or interactivity of an application until a developer has implemented it. The translation of that design is often imperfect, with designer and developer sometimes at odds over an object being a pixel out or the wrong color shade. How can we build stronger bridges between the two? Enter Flash Catalyst.
Adobe has recently released the first public beta of Flash Catalyst, a new tool to help designers become more involved in the process of building RIA interactions. Designers can use Catalyst to build interactive interfaces for the Flash Player from work they’ve created in either Illustrator or Photoshop, with support for Fireworks slated to follow in a later release. Catalyst is capable of maintaining virtually all the characteristics of the original artwork; users can create interfaces in the applications with which they’re most comfortable, import them to Catalyst for more changes, then complete the round-trip back to the original design tool for further design alterations. Of course, since Catalyst is still in beta, there are some missing options that should come in later beta releases, but it still will give the user a good feel for what’s to come.
As well as converting artwork into a Flash interface, Catalyst includes tools to add interactive elements to the design. This initial release has the ability to convert objects into a limited but useful number of UI components, including data lists, buttons, and scrollbars, with extra UI controls available for wireframing interfaces directly in the Catalyst design view. Catalyst also includes tools for managing state and animated effects. Developers are likely to enjoy Catalyst because the designer can now turn objects into buttons before handing over the design, thus reducing a developer’s workload. It will also mean that there should be less possibility of designs being improperly applied to Flash applications, since all the visuals have been prepared in advance.
We’re going to create a simple Flash application that will display information retrieved online via Yahoo’s YQL (Yahoo Query Language) service. For dynamic content we’ll use four YQL queries to retrieve a variety of music chart information. To help make this tutorial easier, we’ve decided to use example queries from the YQL site. Yahoo also provides design stencils that you can use to prototype your next RIA masterpiece; the tab stencils from the Yahoo design kit were part of the inspiration for the design of this application.
To begin, I’ve taken a vertical tab design out of the Yahoo stencil kit and imported that into Illustrator. The next task is to create the outline shape of the application – in this example I’ve used Illustrator’s drawing tools to design a box for that, with two rounded corners and a gradient fill to lift it up a bit. The app we’re building will be retrieving multiple rows of data from the YQL service as XML, so the next job is to define a way to display that repetitive data. Depending on the type of data, the typical interface pattern is to display information in either rows or tiles – here I’ve used rows.
We’ll then need to create artwork to represent a single row of music chart data. The data that we’ll receive could include chart position, a URL for album cover artwork, a chart position shift indicator, and the names of the artist and track. Lastly, there’s a scrollbar, designed to match the curvy corners of the application.
Next, we’ll need to create artwork to represent the detail view state for the application. In Catalyst, we’re able to specify different states using different files or different layers within the file. Catalyst also has a simple timeline, which may be used to control the timing of objects fading in and out as we switch between states.
With that done we’re ready to show the mockups to a client for feedback, finalize the design, and bring it into Catalyst for some interactivity! Here’s the mockup displaying both states of our app.
Next, it’s time to start adding interactivity in Catalyst.
Time to jump into Catalyst! Use the option to create a new project from an existing design file, and open the Illustrator file that we’ve created. It’ll take a moment or two to parse the file – naturally you should pay attention to the prompts for options like canvas size and editable regions, but in this example we’ll leave everything set at default.
Let’s begin with the track/artist chart display part of the design. We’ll convert this into a predefined Catalyst component called a Data List. Select any object in the design, and you’ll see a floating gray panel called the Heads Up Display (HUD) appear. This is used to create and manage interactive components.
The column of options on the right of the screen contains a series of panels that may be familiar if you’ve used Flash previously. In here you’ll find layers, library panels, and property panels as you normally would in Flash to manage various aspects of your content. As in Flash, the higher an object is in the Layers panel, the closer it is to the top of the stack of objects – that’s an important point to remember. The Layers panel is also a good way of quickly selecting specific objects, especially if they’re small or otherwise difficult to click on.
The list is made up of repeated items with a scrollbar to move through the content. We’ll start by converting the scrollbar art into a working scrollbar. Select the elements that make up the scrollbar design. In our slider, we have a track, a thumb, and three small lines representing the thumb’s grip; we’ll select all these, and choose Convert Artwork to Component > Vertical Scrollbar from the HUD. You might find that it’s easier to grab the items from the Layers panel, especially when they’re quite small, like the tiny texture on our scrollbar.
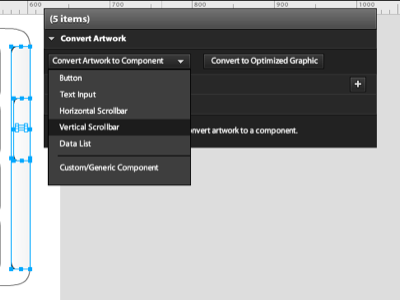
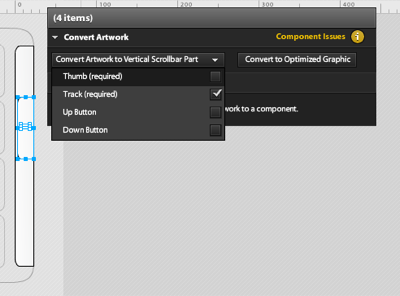
Once converted, you should see a small yellow message in the HUD indicating that there are some component issues: this is because we still need to identify the individual parts that make up our scrollbar. Choose Edit Parts from the HUD, and select the track, then define it as the scrollbar’s Track from the Convert Artwork drop-down. Select the thumb image and the gripper artwork, and set them as the Thumb part from the same set of options.
Now that we’re finished with the scrollbar, we’ll need to return to the main Design window to continue building the application. There’s a breadcrumb-like indicator at the top left of the design area listing which part of the application you’re in; click on the first item in the breadcrumb to return to the whole application.
The next component that we’ll use within the design is the repeated list item, representing how each row of information will look within our Data List. We’ll only need one of the rows that we created for the mockup, as this is all Catalyst requires to determine how the items should look, so we’ll delete the bottom three and just keep the first one. Then select all the graphics for that first row, plus the scrollbar component that we’ve just created, and use the HUD to convert the artwork to a Data List component.
Once again, a yellow message appears to indicate that there’s an issue with the component – we need to identify what element will form the repeated item. Select the artwork for the whole row, click Edit Parts, and define the row with the HUD to a Repeated Item. You should see that item will repeat down the window.
The size of the Data List affects what’s currently displayed, including the way that content will be cropped as you scroll up and down later on, so now’s the time to adjust the size of the data list to taste. Using the breadcrumbs above, double-check to see that you’re still within the Data List component, then use the drag handles to adjust the height of the list accordingly. We’ll extend the height of the Data List component to just inside the application itself; that way the list will appear to be masked by the application when it’s in use.
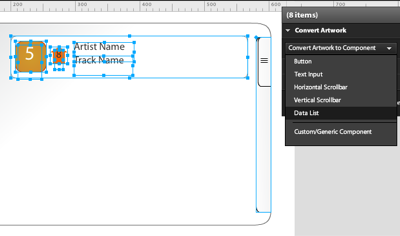
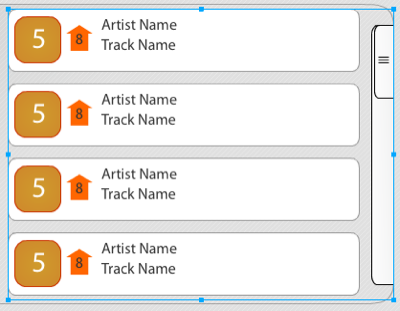
Let’s see how that looks. From the File menu, select Run Project. Flex will begin building your application, and a new browser window will appear. If all went well, you should find that you can scroll up and down the Data List using your scrollbar.
The next step in our application is to start adding the interactions to the design – but you’ll have to stay tuned for the next part of this tutorial for that! In Part II, we’ll add more interaction, show you how to take your Catalyst project into Flash Builder, and populate the application using queries generated via Yahoo’s YQL service.
For now, save your project, and relax – we’ll see you in Part II!
Think you have what it takes to be a Flash Catalyst guru? Prove it with our quick quiz!
via Comments on:
Simple scalability - that's the Terracotta value proposition. In this Quick Q&A with SYS-CON's Cloud Computing Journal editor-in-chief Alan Williamson, Geert Bevin - Evangelist at Terracotta Inc - explains that how Terracotta helps enable Java in the Cloud...and clarifies the difference between the commercial and OSS editions of Terracotta.
The common methods for functional GUI testing are the "record and execute" script technique and writing test programs for different scenarios. In the "record and execute," the test designer interacts with the GUI and all the events are recorded in a script. The script can later be replayed to re-create user interactions for a particular scenario. In the test programs, the test designer tries to understand and write tests for the various GUI decision points. This article discusses how Abbot can be used to quickly and effectively come up with a comprehensive GUI test framework for Swing GUI applications. Abbot (http://abbot.sourceforge.net/) is a JUnit extension for Swing GUI testing. It provides an interesting framework that can be used for test case generation as well as "record and execute" scripting.
JavaBlackBelt, a global leader in Java learning and powered by over 50,000 developers in its global community, today announced immediate availability across the EU, the U.S., and India of its “Java & OO Fundamentals” and “Java Advanced” Coached eLearning courses. Coached eLearning combines Java coaching and eLearning to deliver the fastest and most cost-effective way to gain Java skills. In a recent survey of members of the JavaBlackBelt community, developers selected Coached eLearning as the #1 choice for Java learning compared with instructor-led classroom training and self-paced eLearning.